WANT TO BUY OR SELL A PROPERTY?
CALL US TODAY · 808-298-8956

Real Estate Professionals With Mission Critical Results

Fred Says: Permitting More Housing Positively Impacts Housing Price


One thing you’ll notice right away is a maddening feature of data when it comes to cities: we can’t really see Nashville but only a broader area. This is a confounding feature of housing data. The United States Census will often lump together cities and call them a metropolitan statistical area or MSA. No big deal, right? But often disputes about housing take place in the strict boundaries of cities, and when data is more diffuse than that, it confounds what you can say about cities proper versus their surrounding area. We’ll go with Fred’s MSA data.
Next up, let’s look at permitting. Fred tracks this data using Census numbers. When we take the annual number of permits issued and compare it to population, there is an interesting ratio.
Paragraph
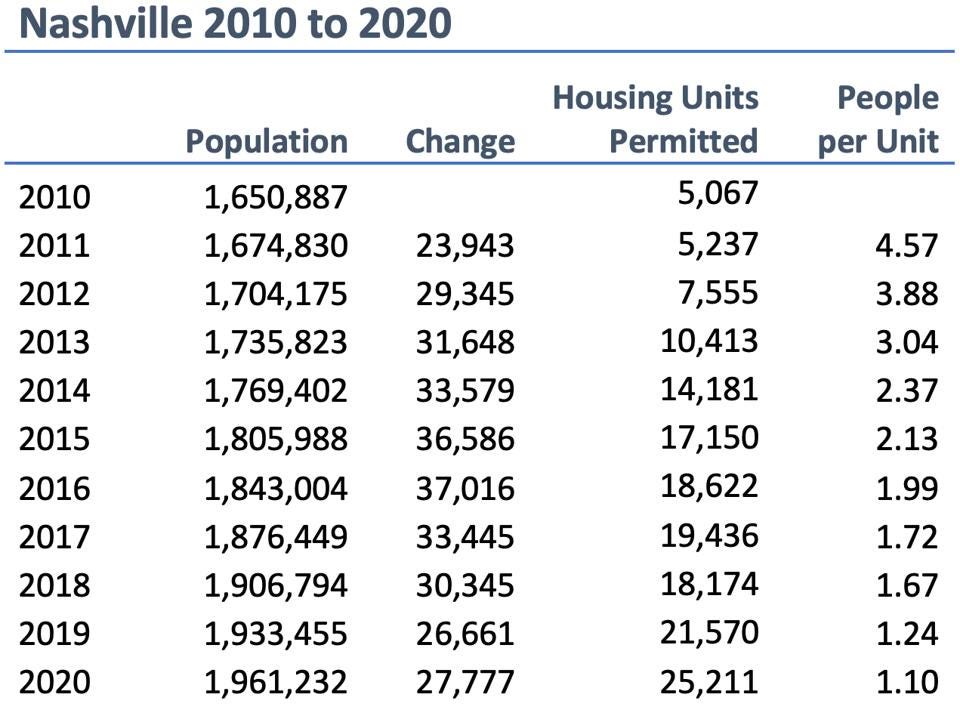
There are all kinds of problems with this. First, and most obvious, a permit doesn’t equal an actual inhabitable housing unit. That’s why I am pursuing more nuanced data about the time to permitting. My hope is that we can see the span of time it takes between permitting and when a unit actual becomes livable. Still, this ratio of new units to new people is worth considering. The 33,579 people that arrived in Nashville in 2014 for example, needed a place to live. There are factors like vacancy rates – it is often called “absorption” – and other factors to consider. But the relationship between new people and the number of permits is relevant. It means less competition between people looking for scarce housing units.
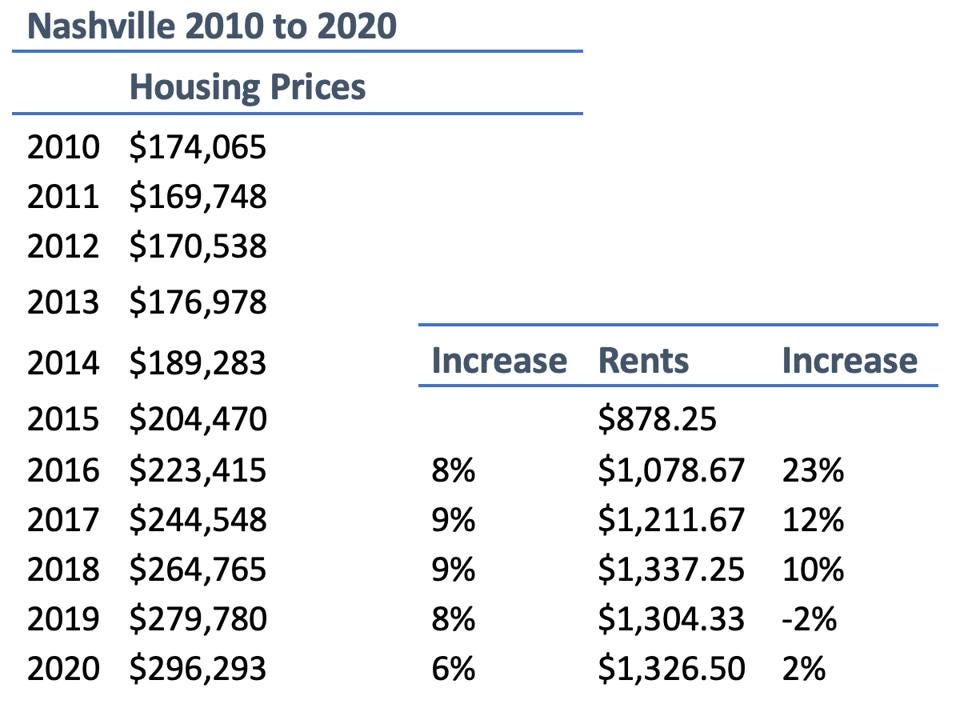
Now let’s look at price. Fred doesn’t track rents, but it does track “All-Transactions House Price.” Here’s the change over the ten-year period in housing prices along with Zumper’s tracking of rents over the last five.


What’s apparent here is that when we compare the trend in permitting, population, and price, there is a relationship.
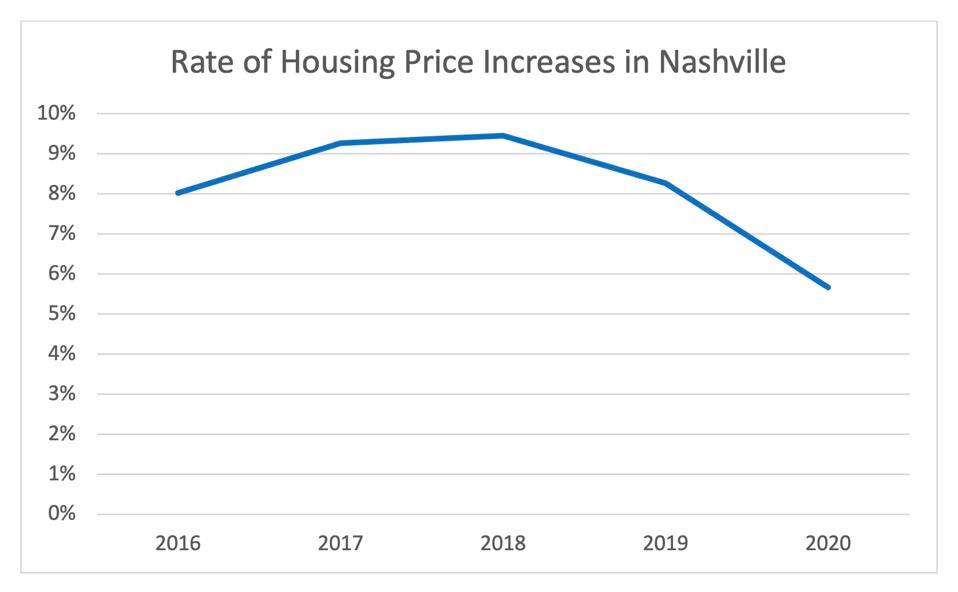
Permitting appears to catch up to population growth in Nashville over the ten-year period, and when we look at the five years we have for rent and housing prices, those begin to soften along with the apparent increase in production. As the ratio of new people to housing units permits falls, so does the rate of increases in price.
But I still have questions, even doubts. The Fred data looks at “estimated using sales prices and appraisal data” to get at price. What does that mean exactly? Rent data from different sources can vary significantly and so can local estimates of price. A big problem with permitting data is that it doesn’t tell us when the units permitted actually go into service. Also, local data would reveal much about the length of time it takes to get a permit.
This first look at public facing data appears to validate my longstanding argument that more supply means lower prices. I still think that is true. But unlike my counterparts on the left who are happy to confuse correlation with causation, I simply can’t. More local data on actual permits, prices, and dates of when housing went into service would make an even stronger case. But this is a good start.
But as we try to dig deeper into fast growing cities like Nashville, and we look at the data we do have, there is a trend: when population increases and permitting follows, we see price increases begin to fall.
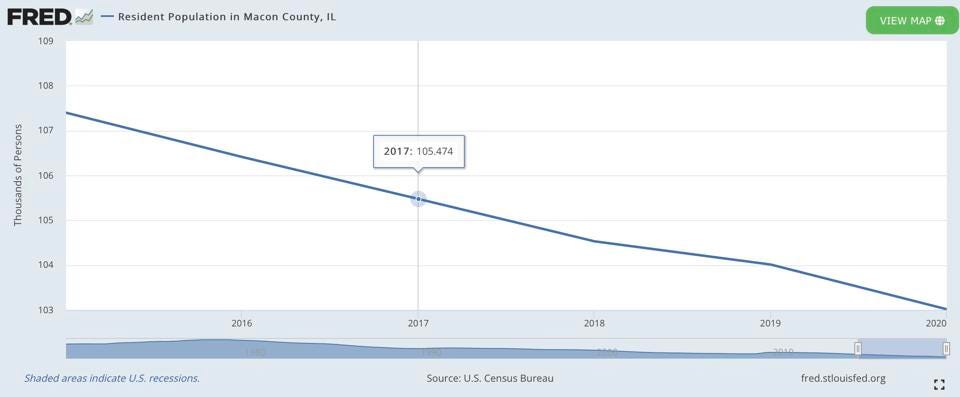
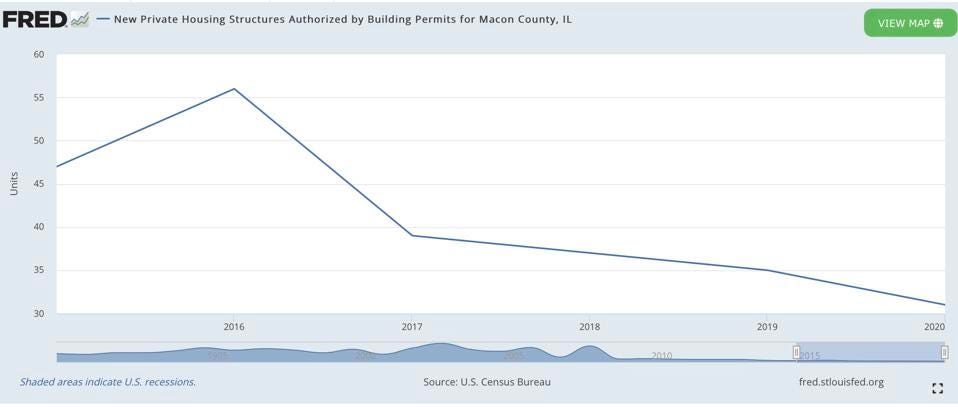
Finally, there are some interesting blips that are out there as well. For example, one of the fastest shrinking cities in the United States actually shows an upward tick in housing prices since 2018. A local television station ran a story last year about how the “Housing market heating up in Decatur.”
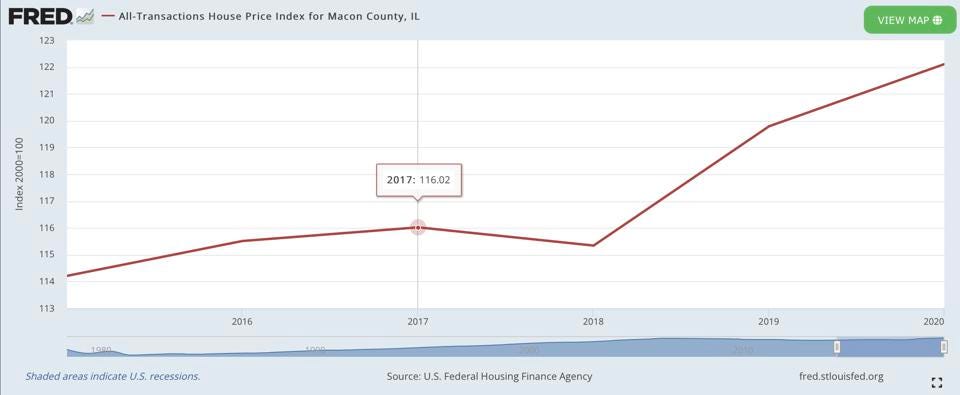
And what about rents? Zumper shows a 26% increase in rents in Decatur over the last year, about $123 on average. And a look at their graph of rents over the last few years shows a similar trend as housing prices.

What’s going on in Decatur? Rising inflation from big cash dumps by the federal government and supply chain problems? Maybe. But those are features of the last two years, and the growth in prices has been unfolding since 2018 apparently. Why? It’s worth considering.
What we need is for local jurisdictions to be as interested in these measures as I am and to use them to better manage housing economies. In the end, the basis of any functioning and fair and efficient economy is lots of exchanges between buyers and sellers. When producers see demand, they naturally want to produce more. Slowing that down only hurts people looking for housing, especially people with less money.
There is more work to be done, but it would be far better to err on the side of more housing rather than more rules and delays.
The reason behind using models from someplace other than hawaii is due to the availability of statistical data. some areas are tracked better, have more transparency and available information, however that doesn't mean the models don't apply here.


LOCATION
214 Hooulu Lane #305
Wailuku, Hawaii 96793

BOOTS ON THE GROUND
Consider Ascentia Maui to be your resource for all Real Estate Needs with a heavy emphasis on Probate, Trusts, Conservatorships and Guardianship Sales. You can also count on Ascentia Maui as your 'Boots on the Ground' for Cleaning, Lawn service Surveys, Inspections, Contractors or anything you may need.
CONTACT US
ascentia Maui, LLC is an organization that operates under the brokerage licensing of Keller Williams Realty Maui. Paragraph
285 W. Kaahumanu ave. #201 Kahului, Hawaii 967362w
Each office is independently owned and operatedParagraph